Workload Autoscaler Installation Troubleshooting
This document provides troubleshooting guidance for common issues encountered during Workload Autoscaler (WA) installation.
Symptom 1: Workload Status Stuck at “Optimization: Recommending”
If a workload’s status remains stuck at Optimization: Recommending for an extended period, it usually means either the workload is still in its initial onboarding gate or the required metrics are not being collected properly.
Before assuming metrics are broken, first check whether the workload was only recently brought under Workload Autoscaler management. By default, newly managed Deployment, StatefulSet, and DaemonSet workloads stay in an initial optimization data window gate until the first configured CPU/Memory history windows are satisfied; Java workloads also wait for the required JVM coverage windows. This first pass is accumulated from workload-level history, so ordinary Pod churn during a rollout does not reset the collection progress. During this phase, recommendations may already exist in APC status, but RecommendationReady remains False and optimization actions stay paused.
Quick verification:
export APC_NAME=<your-apc-name>
export NAMESPACE=<your-namespace>

kubectl get apc "$APC_NAME" -n "$NAMESPACE" -o jsonpath='{.status.initialOptimizationDataWindowSatisfiedAt}{"\n"}{range .status.conditions[*]}{.type}={.status} {.reason} {.message}{"\n"}{end}'- If
initialOptimizationDataWindowSatisfiedAtis empty andRecommendationReady=Falsewith reasonInitialOptimizationDataWindowPending, the system is still collecting enough first-pass data. - Once the timestamp is set, this onboarding gate is latched and later rollouts do not reset it.
- If you self-manage the controller and want to skip this behavior, set
ENABLE_INITIAL_OPTIMIZATION_DATA_WINDOW_CHECK=false.

1. Check if Metrics Are Being Collected
The Workload Autoscaler requires specific metrics to generate recommendations. You can verify if these metrics are being collected by querying your Prometheus endpoint.
Using Prometheus:
If your cluster uses Prometheus, you can use curl to query the Prometheus API directly from a pod:
# First, find a pod with curl available (or use a temporary pod)
kubectl run -it --rm debug --image=curlimages/curl --restart=Never -- sh

export PROMETHEUS_ENDPOINT=<your-endpoint>

# Query the Prometheus endpoint
curl "${PROMETHEUS_ENDPOINT}/api/v1/query?query=container_cpu_usage_seconds_total"

# Query resource requests metrics
curl "${PROMETHEUS_ENDPOINT}/api/v1/query?query=kube_pod_container_resource_requests"

# Query the status of scrape
curl "${PROMETHEUS_ENDPOINT}/api/v1/targets?scrapePool=kube-state-metrics"
Using VictoriaMetrics:
The Workload Autoscaler installation includes VictoriaMetrics (which is deployed by default), you can access the VMUI interface to inspect collected metrics:
# Port-forward to VictoriaMetrics service
kubectl port-forward svc/cloudpilot-victoria-metrics -n cloudpilot 8428:8428
Then open your browser and navigate to http://localhost:8428 to access the VMUI interface.
2. Special Case: GKE with Managed kube-state-metrics
If you are using Google Kubernetes Engine (GKE) with GKE-managed kube-state-metrics, the metrics required by the Workload Autoscaler may not be collected by default.
According to the GKE metrics documentation , GKE-managed kube-state-metrics has limited metric collection capabilities. The Workload Autoscaler requires specific metrics that are not available in the managed version.
Solution:
You need to disable the GKE-managed kube-state-metrics and deploy the open-source version instead:
-
Disable GKE-managed kube-state-metrics by updating your cluster configuration to not include kube-state-metrics in the monitoring configuration.
-
Deploy the open-source kube-state-metrics using the official Helm chart or manifest:
kubectl create ns monitoring helm install kube-state-metrics oci://ghcr.io/prometheus-community/charts/kube-state-metrics -n monitoring -
Wait a few minutes and re-check if the metrics are being collected.
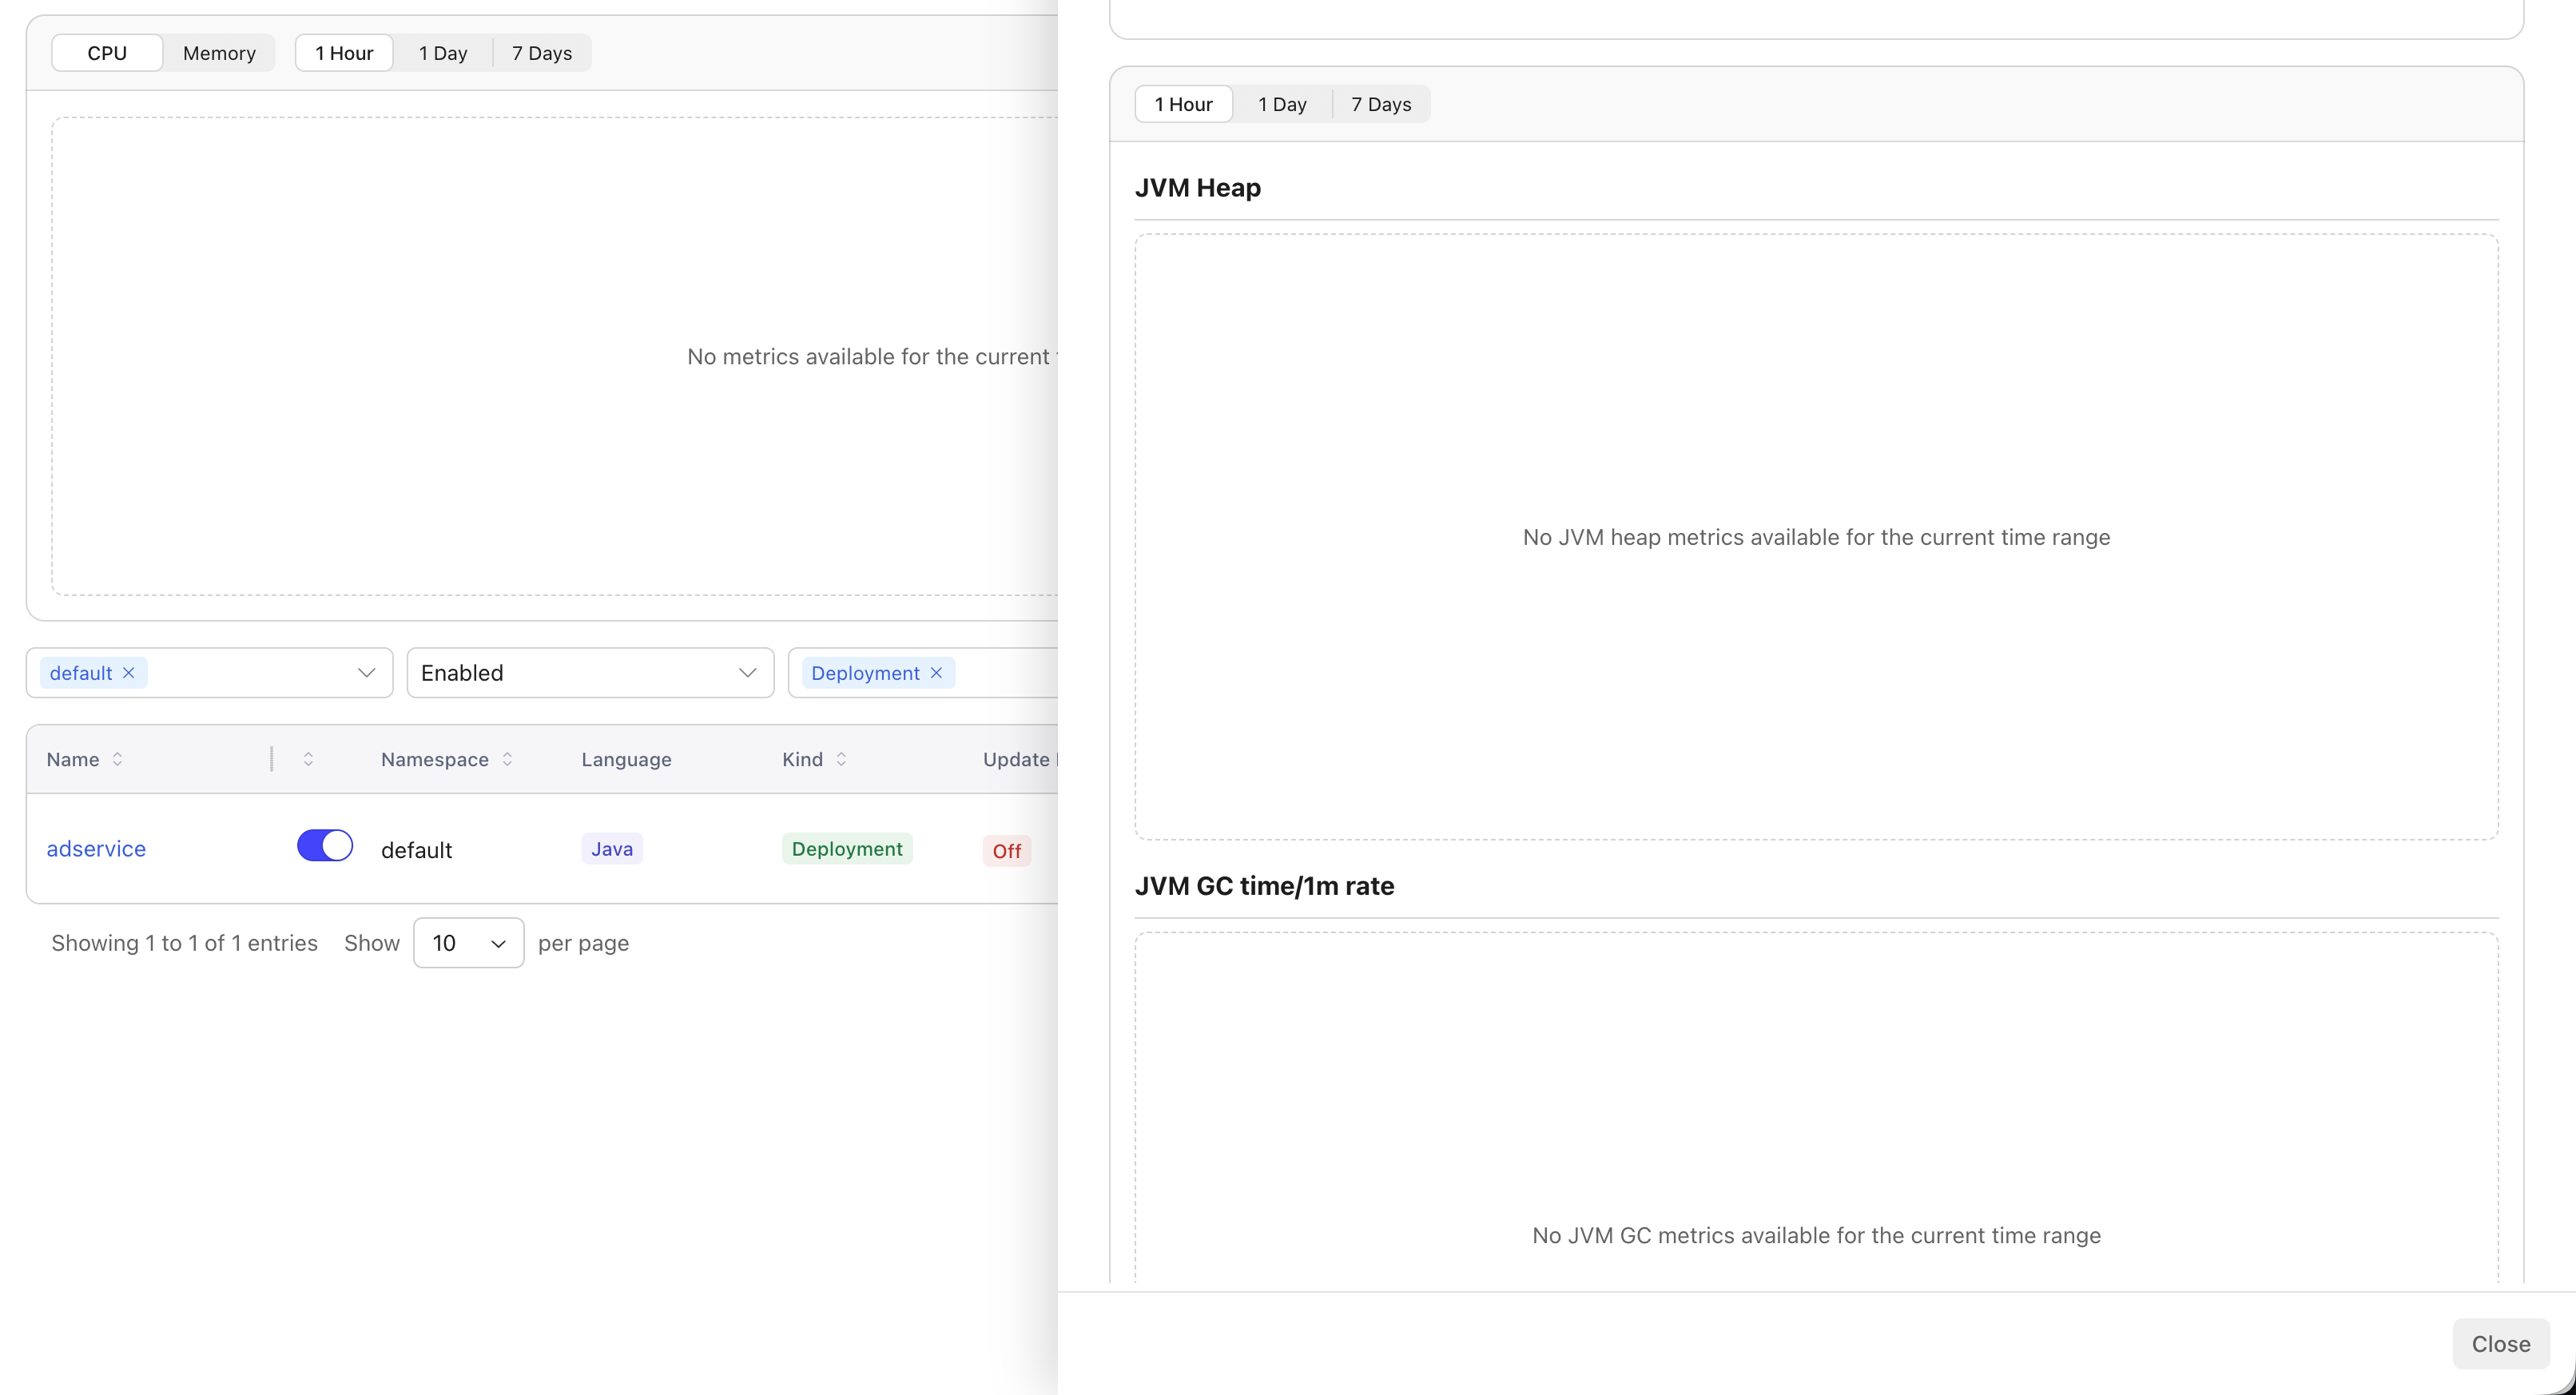
Symptom 2: Missing JVM Data for Java Workloads
If JVM metrics are missing for Java workloads, this is typically caused by security context configurations that prevent the CloudPilot Node Agent from accessing the Java process.
1. Check Workload Security Context
The CloudPilot node agent cannot collect JVM data from Java pods that have specific security context configurations. Check your workload’s security context settings.
Verify the security context configuration:
export WORKLOAD_NAME=<your-java-workload>
export NAMESPACE=<your-namespace>
# Check the security context of your Java workload
kubectl get deployment $WORKLOAD_NAME -o yaml -n $NAMESPACE | grep -A 20 securityContext

# Or for StatefulSet
kubectl get statefulset $WORKLOAD_NAME -o yaml -n $NAMESPACE | grep -A 20 securityContext
Required Security Context Settings
To allow JVM metrics collection, ensure your Java workload does not have the following security context settings:
runAsUserreadOnlyRootFilesystem
2. OpenJ9 is Not Supported
The CloudPilot Node Agent relies on JVM-specific files and interfaces to collect JVM metrics. Currently, only HotSpot JVM (the default JVM in Oracle JDK and OpenJDK) is supported.
Eclipse OpenJ9 (commonly used in IBM Semeru Runtime and some AdoptOpenJDK builds) uses a different internal architecture and does not generate the diagnostic files required for CloudPilot analysis. As a result, Java workloads running on OpenJ9 cannot receive JVM-based recommendations.