Saving Report
Saving Report shows how your cluster’s current operating profile compares with the initial baseline captured when CloudPilot AI first onboarded the cluster.
Saving Report always compares:
- A fixed baseline snapshot collected when CloudPilot AI first onboarded the cluster
- A current time range that you select from the page header
This report is designed to answer three questions:
- How much would the current workload likely cost under the original baseline provisioning pattern?
- Are workloads using a larger share of their requested CPU and Memory than before?
- How much have cluster size, workload requests, and per-core cost changed since the baseline?
Access Saving Report
- Open the target cluster in the CloudPilot AI console.
- In the left navigation, go to Cost Monitoring > Saving Report.
- Use the date picker in the top-right corner to choose the current comparison period.
- Optionally click Export PDF to download the report.
Data Availability and Baseline Behavior
Saving Report is currently available for AWS clusters. Support for GCP and Azure is planned for a future release.
The report needs a baseline snapshot before it can render. If baseline resource metrics are not available yet, the UI shows Baseline Data Pending.
Current values are not point-in-time readings. They are averages across the selected time range. Baseline values are fixed values tied to the initial baseline date.
The baseline snapshot is taken from the first day after CloudPilot AI is installed on the cluster.
Feature Breakdown
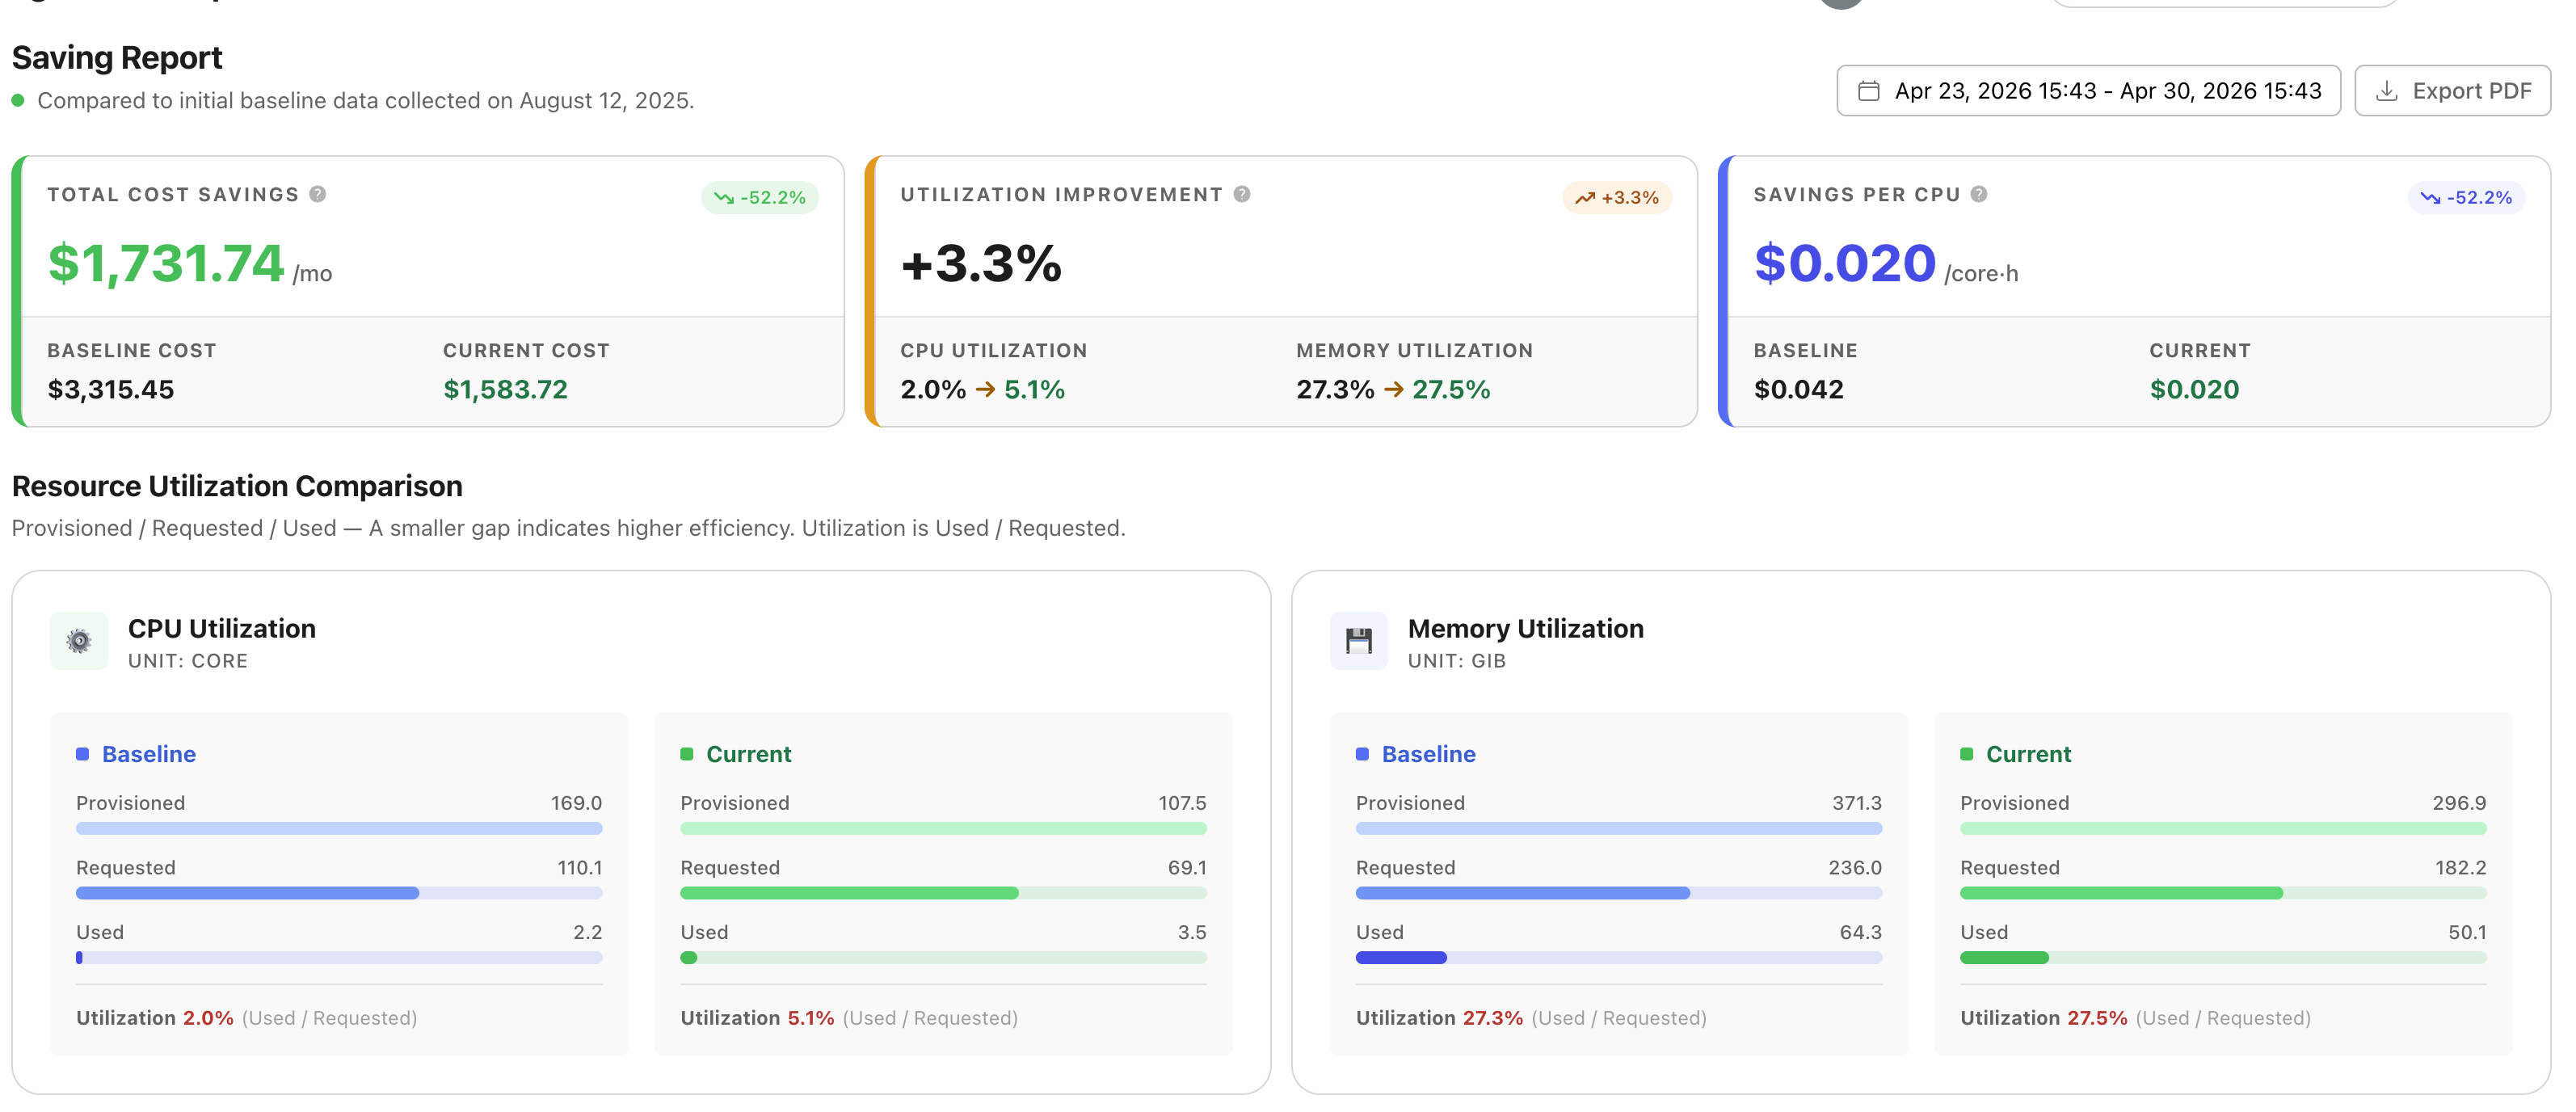
Top KPI Cards
The top row summarizes the report with three headline KPIs:
- Total Cost Savings shows estimated monthly savings versus the baseline operating pattern.
- Utilization Improvement shows how much more efficiently workloads are using requested resources.
- Savings per CPU shows the current cost per provisioned CPU core-hour and its reduction from the baseline.
Resource Utilization Comparison
This section compares Provisioned, Requested, and Used resources for both CPU and Memory.
- Provisioned is total node capacity.
- Requested is the sum of pod resource requests.
- Used is actual measured resource consumption.
- Utilization is always
Used / Requested.
A smaller gap between provisioned, requested, and used values usually indicates better sizing and less waste.
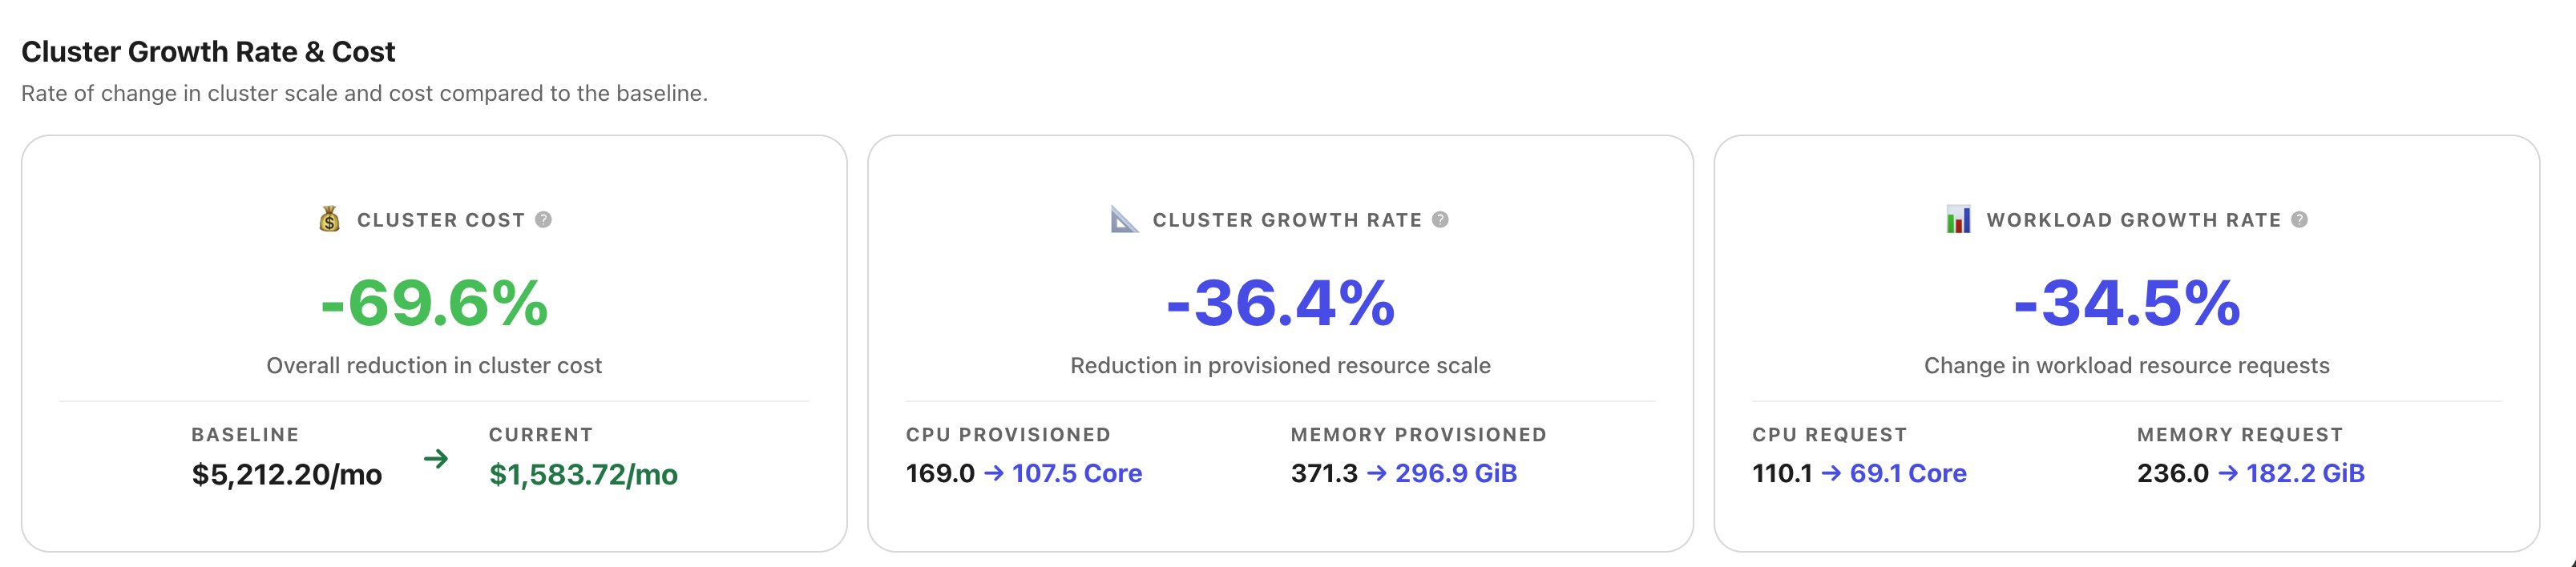
Cluster Growth Rate and Cost
The lower section helps separate efficiency gains from workload or cluster-size changes:
- Cluster Cost compares the baseline monthly cost with the current monthly cost.
- Cluster Growth Rate shows how average provisioned capacity changed from the baseline.
- Workload Growth Rate shows how requested workload resources changed from the baseline.
Understanding the Calculations
Input Values
Saving Report combines two kinds of inputs:
- A fixed baseline snapshot collected at onboarding time
- Current averages calculated over the selected time range
The report uses the following values:
| Value group | Meaning |
|---|---|
| Baseline provisioned CPU / Memory | Node capacity at the baseline snapshot |
| Baseline requested CPU / Memory | Sum of workload requests at the baseline snapshot |
| Baseline used CPU / Memory | Measured workload usage at the baseline snapshot |
| Baseline monthly cost | Monthly cluster cost recorded for the baseline snapshot |
| Current provisioned CPU / Memory | Average provisioned capacity across the selected range |
| Current requested CPU / Memory | Average workload requests across the selected range |
| Current used CPU / Memory | Average measured usage across the selected range |
| Current monthly cost | Average hourly cluster cost across the selected range, converted back to monthly cost |
Resource Utilization
CPU and Memory utilization are calculated independently on the server:
baselineCPUUtilization = baselineUsedCPU / baselineRequestedCPU
currentCPUUtilization  = currentUsedCPU / currentRequestedCPU

baselineMemUtilization = baselineUsedMemory / baselineRequestedMemory
currentMemUtilization  = currentUsedMemory / currentRequestedMemory
The footer values in the KPI card and the percentages shown in the comparison panels use these direct ratios.
The server also calculates the per-resource improvement values:
cpuUtilImprovement = currentCPUUtilization - baselineCPUUtilization
memUtilImprovement = currentMemUtilization - baselineMemUtilization
Utilization Improvement Headline Value
The large number in the Utilization Improvement card is a weighted composite. It is not a simple average of CPU and Memory utilization changes.
baselineWeightedRequested = baselineRequestedCPU * 0.9 + baselineRequestedMemory * 0.1
currentWeightedRequested  = currentRequestedCPU * 0.9 + currentRequestedMemory * 0.1

baselineWeightedUtil =
  (baselineUsedCPU * 0.9 + baselineUsedMemory * 0.1) / baselineWeightedRequested

currentWeightedUtil =
  (currentUsedCPU * 0.9 + currentUsedMemory * 0.1) / currentWeightedRequested

utilizationImprovement = currentWeightedUtil - baselineWeightedUtil
In the current implementation, CPU contributes 90% of this weighted score and Memory contributes 10%. This weighting is intended to approximate the typical CPU-versus-Memory cost split seen in cloud instance pricing, where CPU usually represents the larger share of the machine cost.
Total Cost Savings
The Total Cost Savings card answers a specific question:
What would the current workload likely cost if the cluster were still running with its original baseline provisioning behavior?
The server first estimates how much CPU would have been provisioned under the baseline request-to-provisioning ratio:
initialRatioCPU = baselineProvisionedCPU / baselineRequestedCPU
estimatedOriginalProvisionedCPU = currentRequestedCPU * initialRatioCPU
It then calculates the baseline cost per provisioned CPU core-hour:
costPerCPUBaseline = baselineCostPerMonth / baselineProvisionedCPU / MonthInHours
costPerCPUCurrent  = currentCostPerMonth / currentProvisionedCPU / MonthInHours
Using that baseline per-core cost, the server estimates what the current workload would cost under the original provisioning pattern:
costFromEstimate =
  estimatedOriginalProvisionedCPU * costPerCPUBaseline * MonthInHours

estimatedOriginalCost = costFromEstimate
costSavingsAmount     = estimatedOriginalCost - currentCostPerMonth
costSavingsPercent    = costSavingsAmount / estimatedOriginalCost
The Baseline Cost shown inside Total Cost Savings is estimatedOriginalCost, not the raw baseline monthly cost. That is why it can differ from the Baseline value shown in the Cluster Cost card below.
Savings per CPU
The Savings per CPU card compares baseline and current cost per provisioned CPU core-hour:
costPerCPUBaseline = baselineCostPerMonth / baselineProvisionedCPU / MonthInHours
costPerCPUCurrent  = currentCostPerMonth / currentProvisionedCPU / MonthInHours

costPerCPUSavingsPercent =
  (costPerCPUBaseline - costPerCPUCurrent) / costPerCPUBaseline
A lower current value means each unit of provisioned compute is cheaper than it was at the baseline.
Cluster Cost
The Cluster Cost card uses the raw baseline monthly cost and the current monthly cost:
costGrowthRate = (currentCostPerMonth - baselineCostPerMonth) / baselineCostPerMonthA negative value means the cluster is currently spending less than it was at the baseline.
Cluster Growth Rate
The headline percentage in Cluster Growth Rate is currently CPU-based:
provisionedCPUGrowthRate =
  (currentProvisionedCPU - baselineProvisionedCPU) / baselineProvisionedCPU
The card also shows the baseline-to-current Memory provisioned values as supporting context, but the headline percentage itself is derived from CPU.
Workload Growth Rate
The headline percentage in Workload Growth Rate is also a weighted metric calculated in the frontend:
baselineWeightedRequested = baselineRequestedCPU * 0.9 + baselineRequestedMemory * 0.1
currentWeightedRequested  = currentRequestedCPU * 0.9 + currentRequestedMemory * 0.1

workloadGrowthRate =
  (currentWeightedRequested - baselineWeightedRequested) / baselineWeightedRequested
The detail rows in the card still show the raw CPU request and Memory request values so you can inspect each resource separately.
Reading the Numbers
- Negative values in Cluster Cost, Cluster Growth Rate, and Workload Growth Rate indicate reduction relative to the baseline.
- Positive values in Utilization Improvement indicate better resource efficiency.
- Total Cost Savings shows the savings amount as a positive currency value, while its badge appears as a negative percentage because it represents a cost reduction.