Workload Autoscaler Performance Benchmark
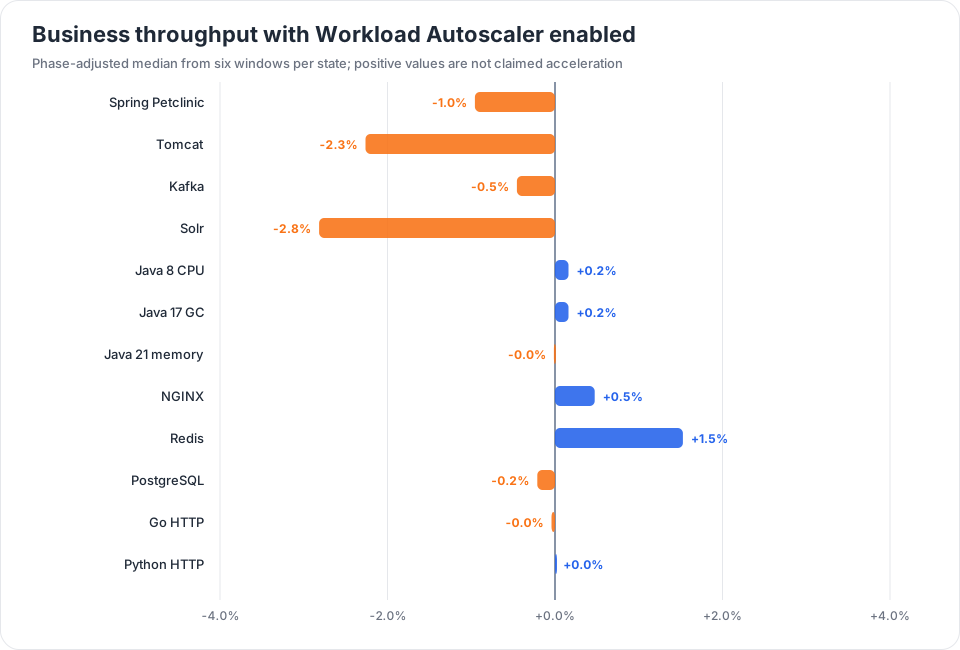
Conclusion: Enabling CloudPilot AI Workload Autoscaler had no material impact on the tested Java and non-Java workloads. Across 12 scenarios, the median phase-adjusted throughput delta was -0.03%, the median absolute delta was 0.33%, all scenarios stayed within ±3%, and the real error rate was zero across 840,615,909 measured requests, records, and transactions.
This benchmark measures application performance and resource pressure with the Workload Autoscaler collection and control plane disabled and enabled. No AutoscalingPolicy was created, and workload replicas, requests, limits, JVM flags, data, and request shape stayed unchanged.
The Java-family median was -0.45% and the non-Java median was +0.00%.
Test environment and A/B controls
| Item | Configuration |
|---|---|
| Cloud | Amazon EKS 1.33 in us-east-1 |
| Nodes | Five fixed m6i.xlarge on-demand nodes (4 vCPU, 16 GiB each): three system, one workload, and one load generator |
| Isolation | The workload and load generator used dedicated nodes in the same availability zone. The load-generator node was excluded from node-agent scheduling. |
| Networking | Amazon VPC CNI; the node security group allowed all measured target ports, including an explicit self-referencing TCP/80 rule for NGINX |
| Workload Autoscaler | Helm chart v0.6.2; controller v0.6.2; node-agent v0.2.4; VictoriaMetrics v1.132.0; kube-state-metrics v2.17.0 |
| Disabled state | Controller and VictoriaMetrics replicas set to zero; node-agent scheduled onto no nodes; zero active Pods in the cloudpilot namespace |
| Enabled state | Four node-agent Pods, two controller replicas, and one VictoriaMetrics Pod with its kube-state-metrics container |
| Crossover | One cluster, alternating ABBA and BAAB order across scenarios; every phase recreated the workload Pod and deterministic data |
| Stabilization | A 90-second equal-age period plus a workload-specific warm-up preceded every measured phase |
| Repeats | Two fresh phases per state and three measured windows per phase: six windows per state, 12 per scenario, and 144 in total |
HTTP and PostgreSQL windows ran for 120 seconds. Kafka produced 15 million 256-byte records per window and deleted the measured topic before the next window. Redis ran 20 million GET and 20 million SET operations per window. Only the final 144 windows that passed the integrity checks were included; setup prechecks and interrupted or unhealthy attempts were excluded.
Workloads and generated data
| Scenario | Version and data | Measured request or transaction |
|---|---|---|
| Spring Petclinic | Commit 88e37c15, Spring Boot 4.1.0, Temurin 21, bundled H2 sample data | Owner search, concurrency 20 |
| Tomcat | 10.1.39, Temurin 17, official examples application | RequestInfoExample, concurrency 24 |
| Kafka | 3.9.0, four partitions, 1,000,000 seeded 1 KiB records | 15,000,000 records of 256 bytes, uncapped producer |
| Solr | 9.8.1, 200,000 generated text/region/value documents | body_t:cloudpilot, 10 rows, concurrency 16 |
| Java 8 CPU | Temurin 8, custom service with 100,000 in-memory records | 250,000 compute iterations, concurrency 24 |
| Java 17 GC | Temurin 17, the same 100,000-record service | 1 MiB allocation per request, concurrency 24 |
| Java 21 memory | Temurin 21, 100,000 records and 160 MiB retained payload | 256 KiB allocation per request, concurrency 16 |
| NGINX | 1.27.5-alpine | Generated 1 KiB static payload, concurrency 32 |
| Redis | 7.4.2-alpine, 2,000,000 seeded keys | 20,000,000 GET and 20,000,000 SET operations, concurrency 64, pipeline 16 |
| PostgreSQL | 17.4-alpine, pgbench scale 50 (5,000,000 accounts) | Read-only workload, 32 clients and four threads |
| Go HTTP | Go 1.25.4, custom service with 100,000 in-memory records | Bucket search, concurrency 32 |
| Python HTTP | Python 3.12 standard-library HTTP server | Directory index request, concurrency 32 |
Results
Phase-adjusted delta is the median of the two paired enabled-versus-disabled phase deltas. The run-level 95% bootstrap interval is an uncertainty indicator, not a production confidence guarantee. P99 and CPU PSI show the disabled and enabled run medians. CPU PSI is the container cgroup v2 cpu.pressure some stall percentage over each measured interval.
| Scenario | Throughput disabled → enabled | Phase-adjusted delta | Run-level 95% bootstrap interval | P99 disabled → enabled | CPU PSI disabled → enabled |
|---|---|---|---|---|---|
| Spring Petclinic | 267.0 → 266.2 /s | -0.96% | -4.79% to +4.36% | 251.0 → 241.5 ms | 65.40% → 65.73% |
| Tomcat | 38,683.3 → 37,887.7 /s | -2.26% | -4.04% to -0.09% | 12.0 → 8.5 ms | 35.12% → 35.96% |
| Kafka | 481,179.1 → 488,891.0 /s | -0.45% | -6.47% to +5.98% | 1,732.5 → 1,457.5 ms | 0.43% → 0.60% |
| Solr | 7,392.9 → 7,194.0 /s | -2.82% | -3.47% to -1.38% | 27.0 → 32.5 ms | 71.23% → 72.33% |
| Java 8 CPU | 471.4 → 471.9 /s | +0.16% | -0.19% to +0.32% | 60.0 → 60.0 ms | 1.81% → 1.91% |
| Java 17 GC | 471.3 → 472.0 /s | +0.16% | -0.05% to +0.28% | 60.0 → 60.0 ms | 0.94% → 0.88% |
| Java 21 memory | 314.3 → 314.3 /s | -0.01% | -0.11% to +0.17% | 60.0 → 60.0 ms | 0.19% → 0.21% |
| NGINX | 49,474.4 → 49,571.1 /s | +0.47% | -1.58% to +2.38% | 2.0 → 2.0 ms | 38.39% → 37.90% |
| Redis | 633,129.4 → 631,897.3 /s | +1.53% | -1.81% to +3.86% | N/A → N/A ms | 0.03% → 0.03% |
| PostgreSQL | 17,758.1 → 17,763.0 /s | -0.21% | -0.86% to +0.54% | N/A → N/A ms | 99.81% → 99.80% |
| Go HTTP | 8,918.2 → 8,915.9 /s | -0.04% | -0.46% to +0.22% | 9.5 → 10.0 ms | 0.24% → 0.19% |
| Python HTTP | 2,287.7 → 2,287.5 /s | +0.00% | -0.32% to +0.32% | 221.0 → 221.0 ms | 4.45% → 4.57% |
ApacheBench reported response-length mismatches only for Solr because the JSON response includes a dynamic QTime field. They were retained separately from transport and HTTP errors; the real error rate was zero in every measured window.
Solr (-2.82%) and Tomcat (-2.26%) had the lowest scenario-specific throughput deltas, while all 12 scenarios remained within ±3%. Kafka’s two paired phase deltas crossed direction (+4.14% and -5.05%), so its -0.45% central estimate is treated as high-variance rather than directional evidence.
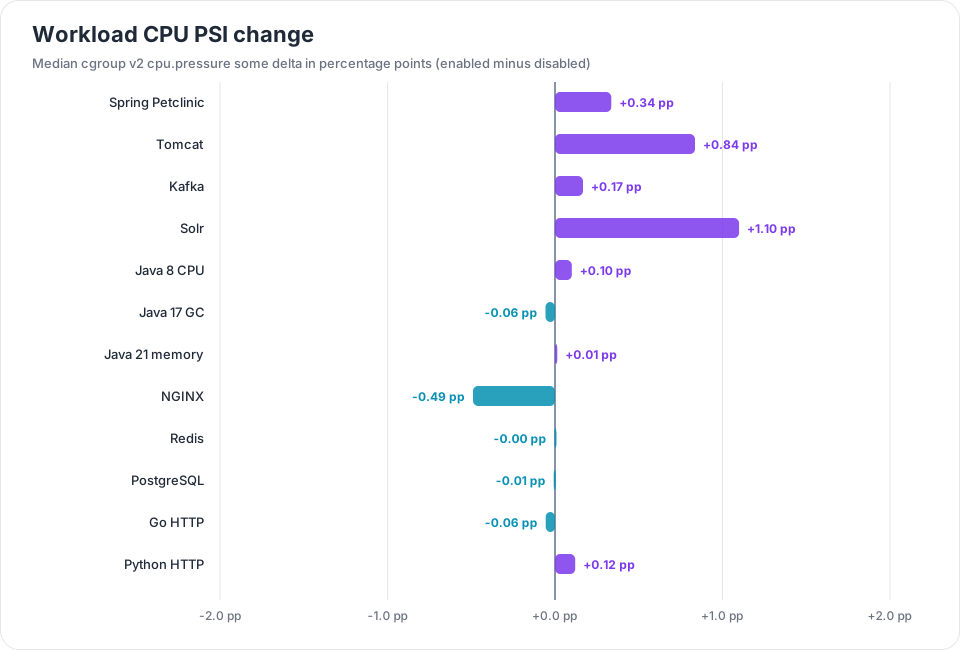
The median CPU PSI change was +0.06 percentage points; the median memory PSI change was +0.0000 percentage points, and the median I/O PSI change was +0.0000 percentage points. The node-agent exported CPU, memory, and I/O PSI for 12 of 12 scenarios. JVM identity and heap metrics were collected for 6 and 6, respectively, of the 7 Java-family scenarios.
Workload Autoscaler footprint
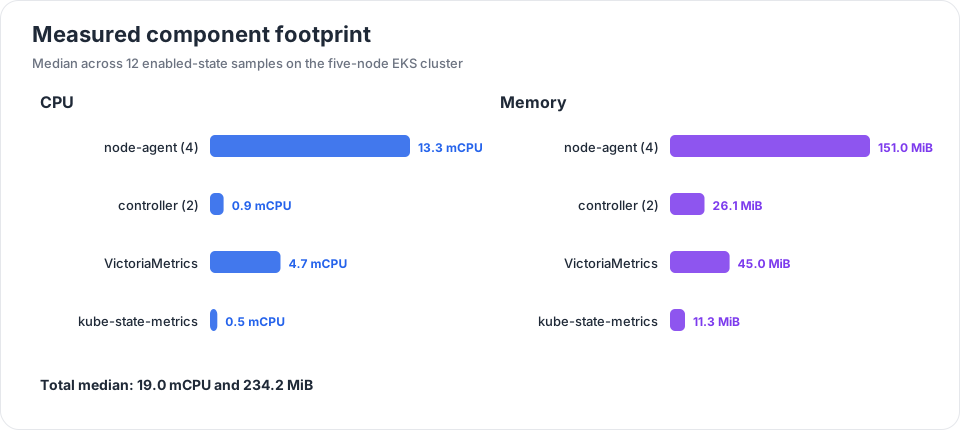
The enabled installation used a median of 19.0 mCPU and 234.2 MiB across 12 scenario samples. This includes four node-agent Pods, two controller replicas, VictoriaMetrics, and kube-state-metrics. Actual resource usage can vary materially for components whose work scales with the number of workloads on their node or across the cluster.